🔥
Launch Offer — Hurry Up! Ends In:
00Days
:
00Hrs
:
00Min
:
00Sec
Save up to 40% OFF · Limited Seats Only
Start Free Trial →
Made for beginners · TradingView indicator

New to the Stock Market?
Read Charts the Easy Way.

NiftyMeter turns a confusing chart into simple coloured bands. Light green or light red means the market is ready to trade. Dark green, dark red or white means wait. You also get step-by-step videos and 5 beginner strategies that explain when to enter, where to place a stop loss and when to book profit — in plain language.

🎁 Start 7-Day Free Trial▶ See How It Works

No experience needed · 7 days free · No card required


5Band Colours
24×7AI Chat Help
5Simple Strategies
500+Learners
Learn the Colours

One Look Tells You What the Market Is Doing

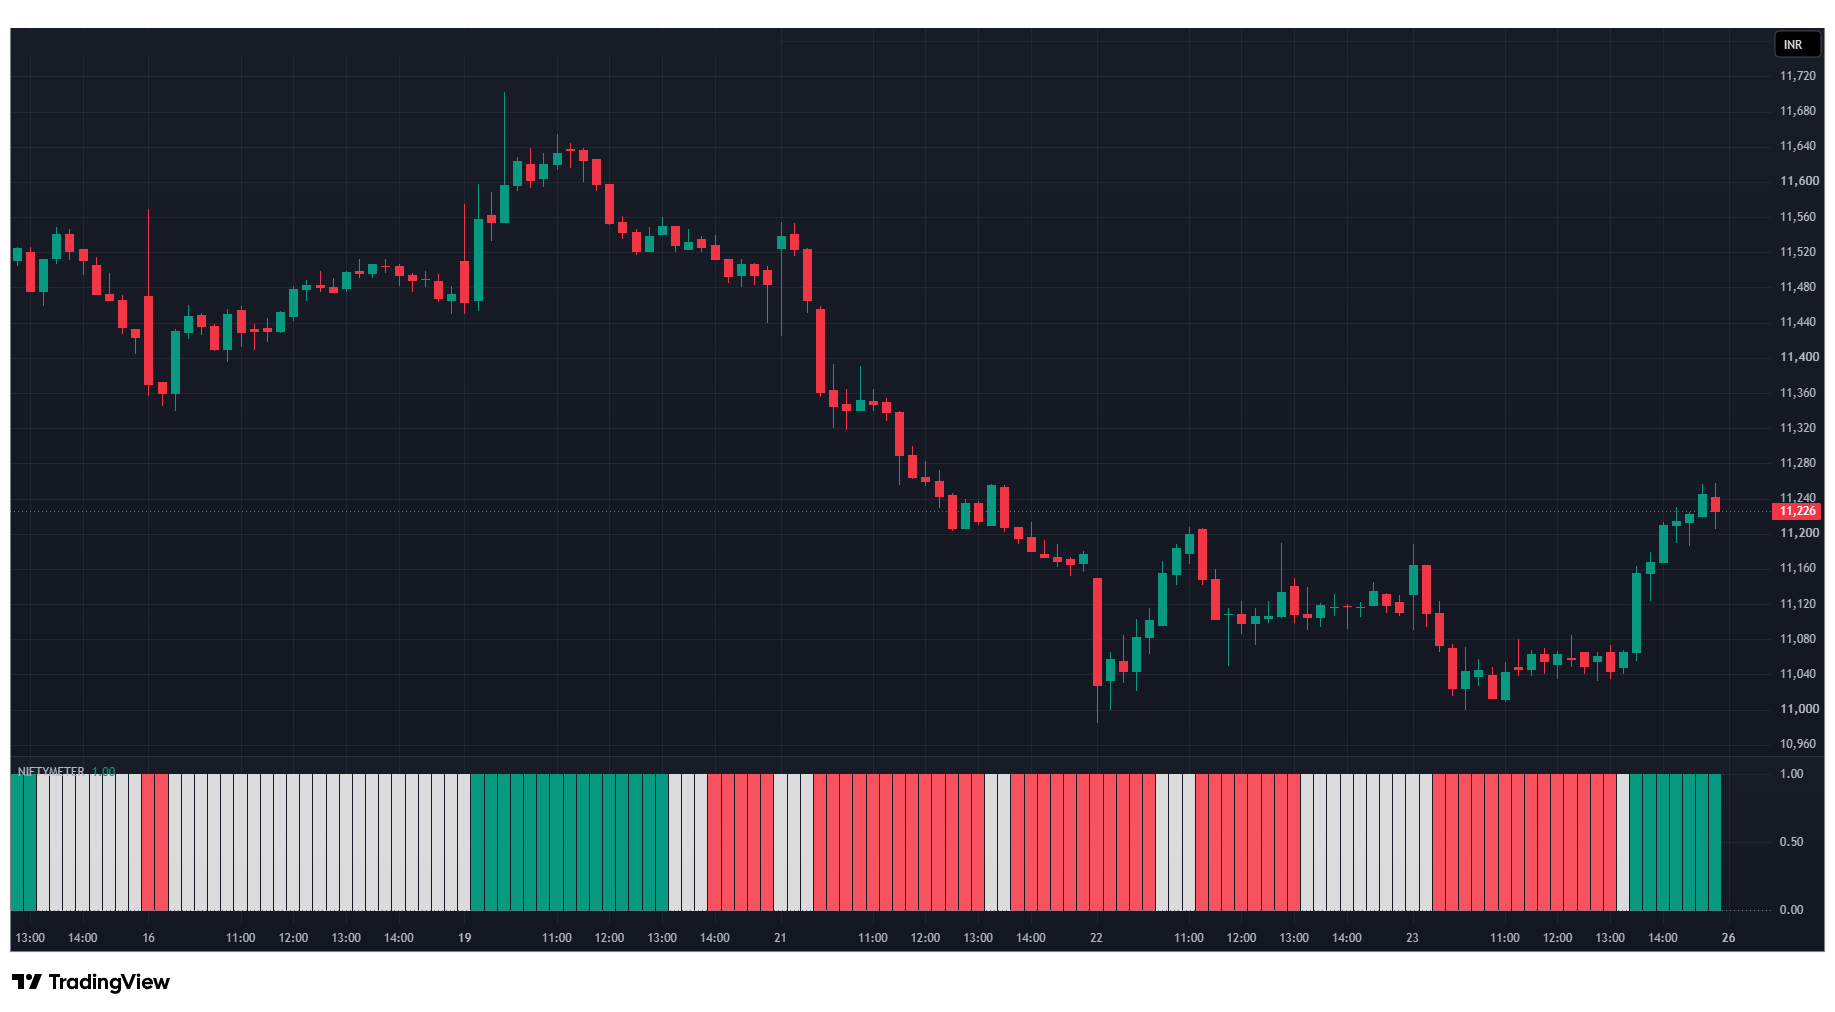
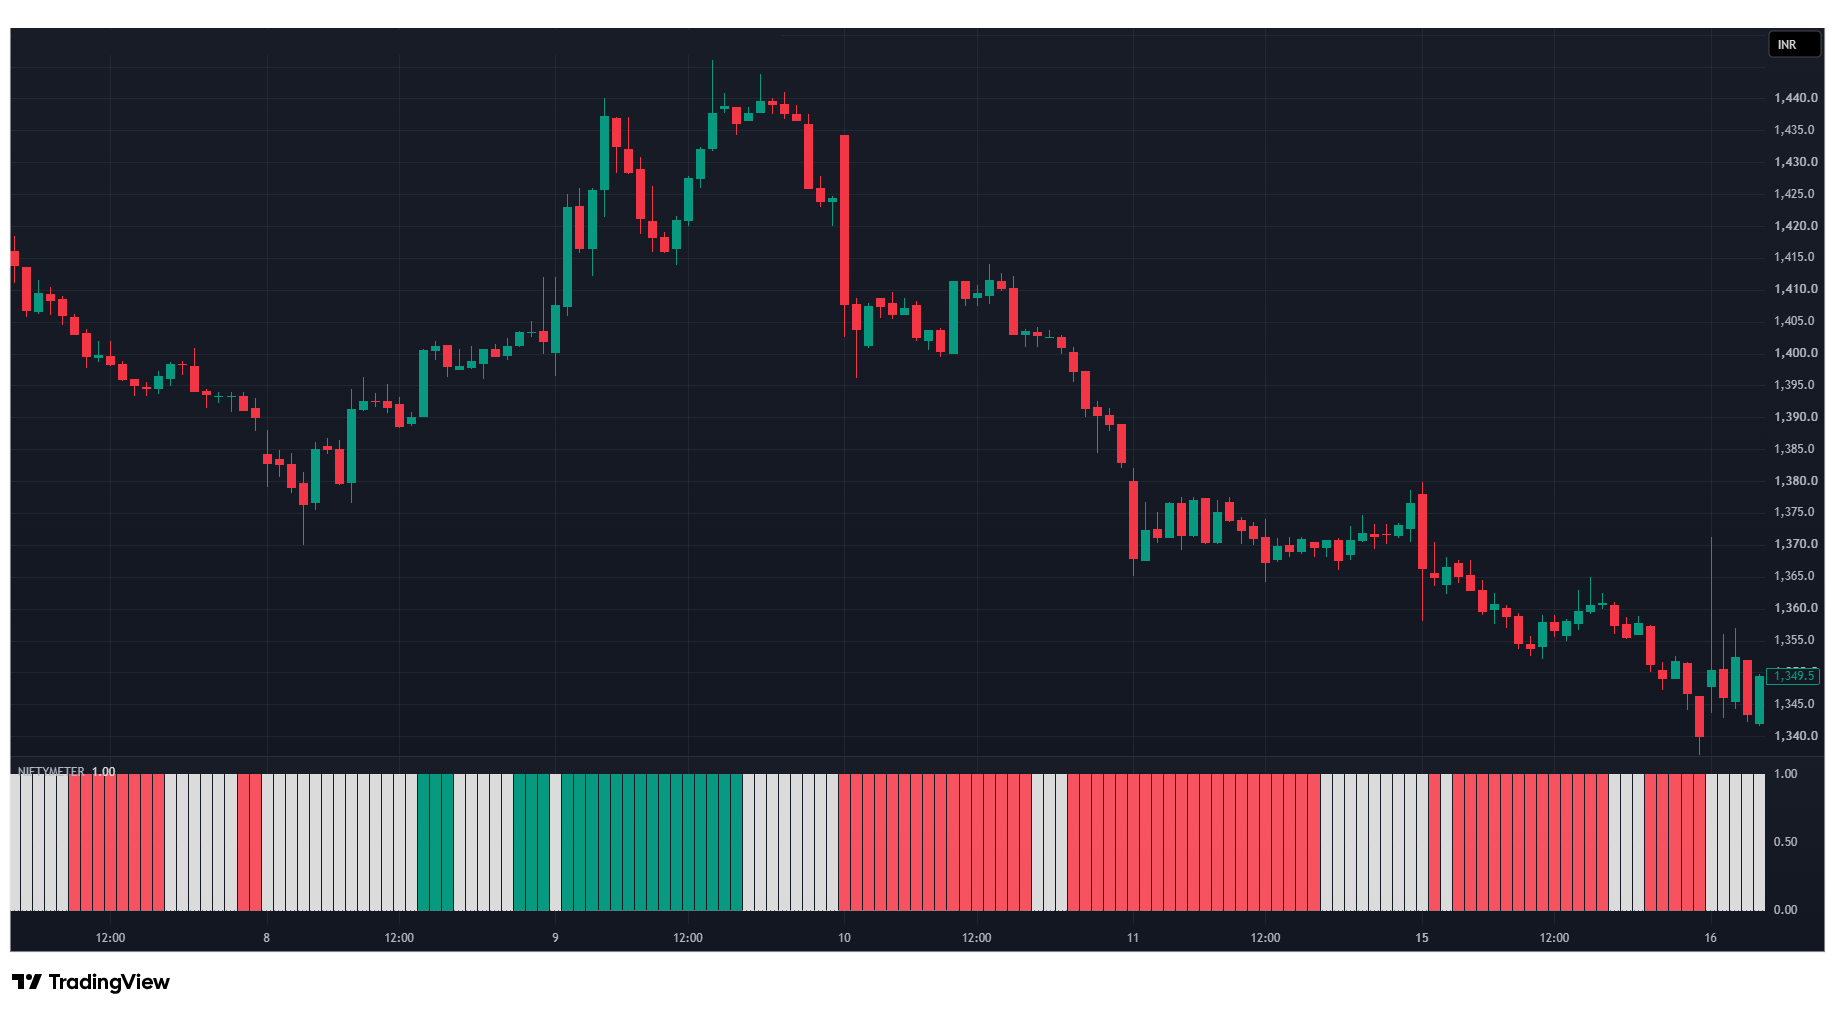
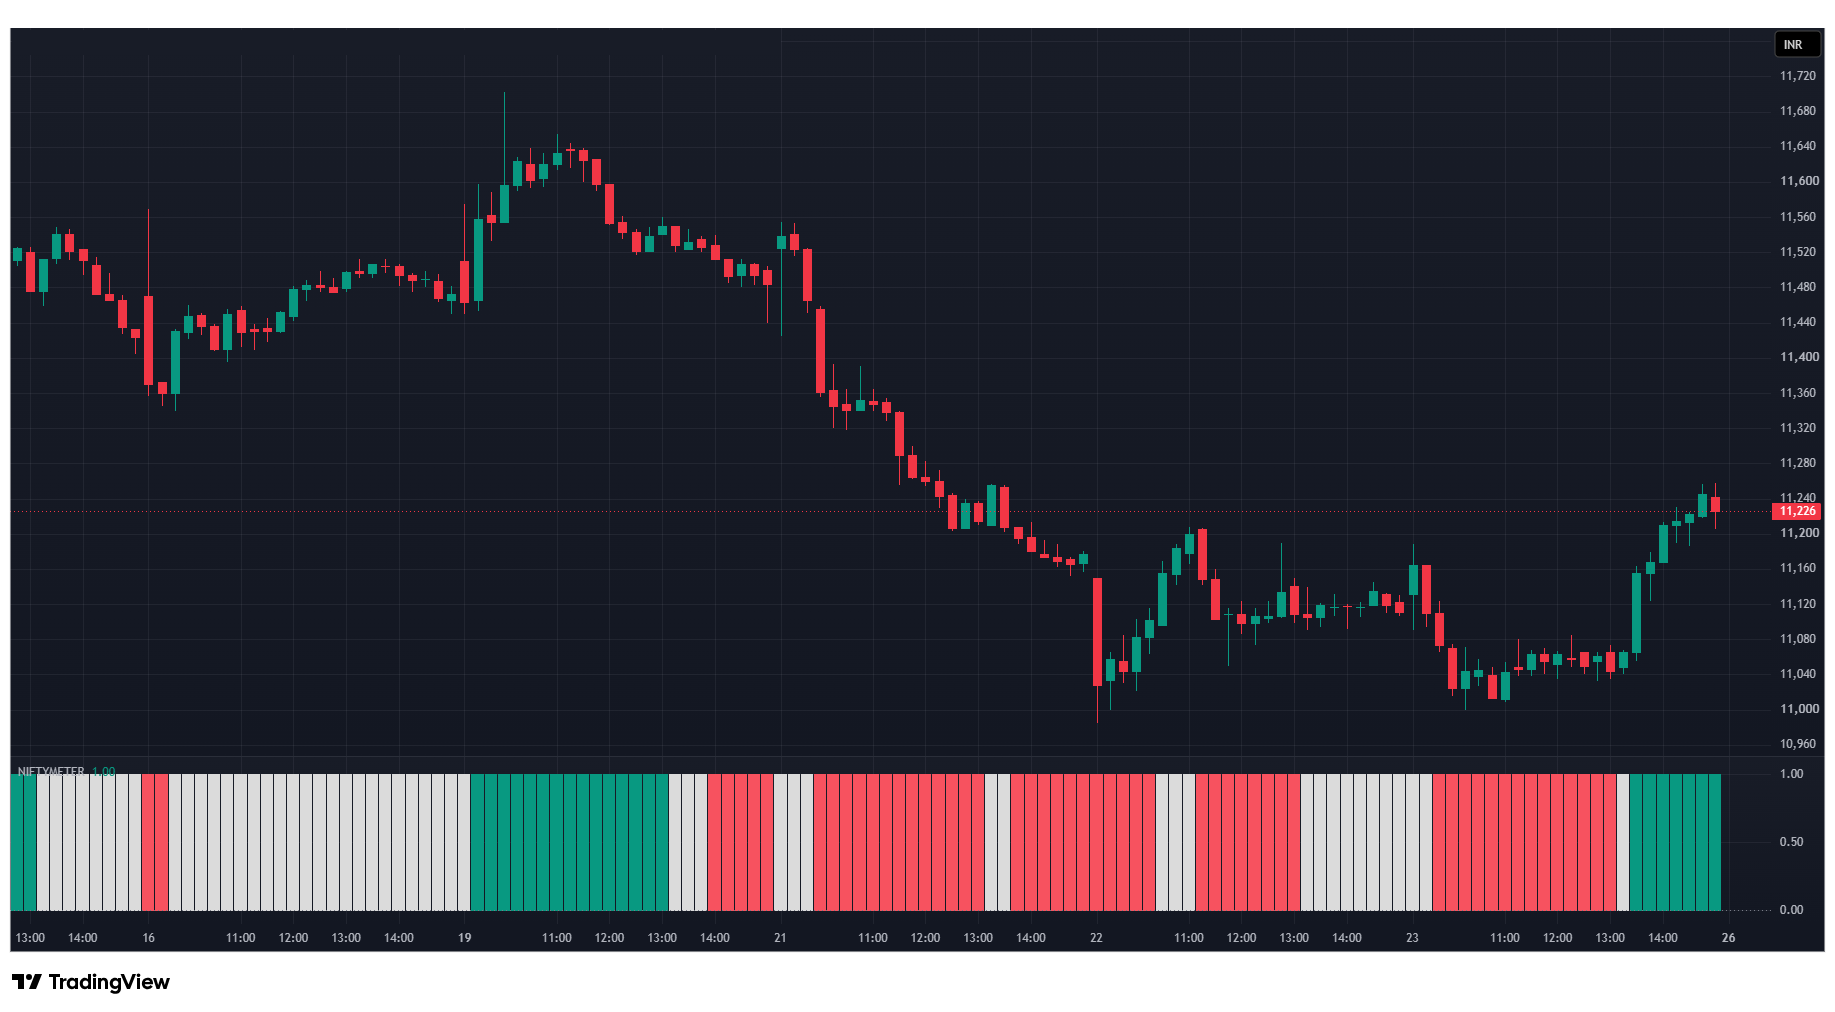
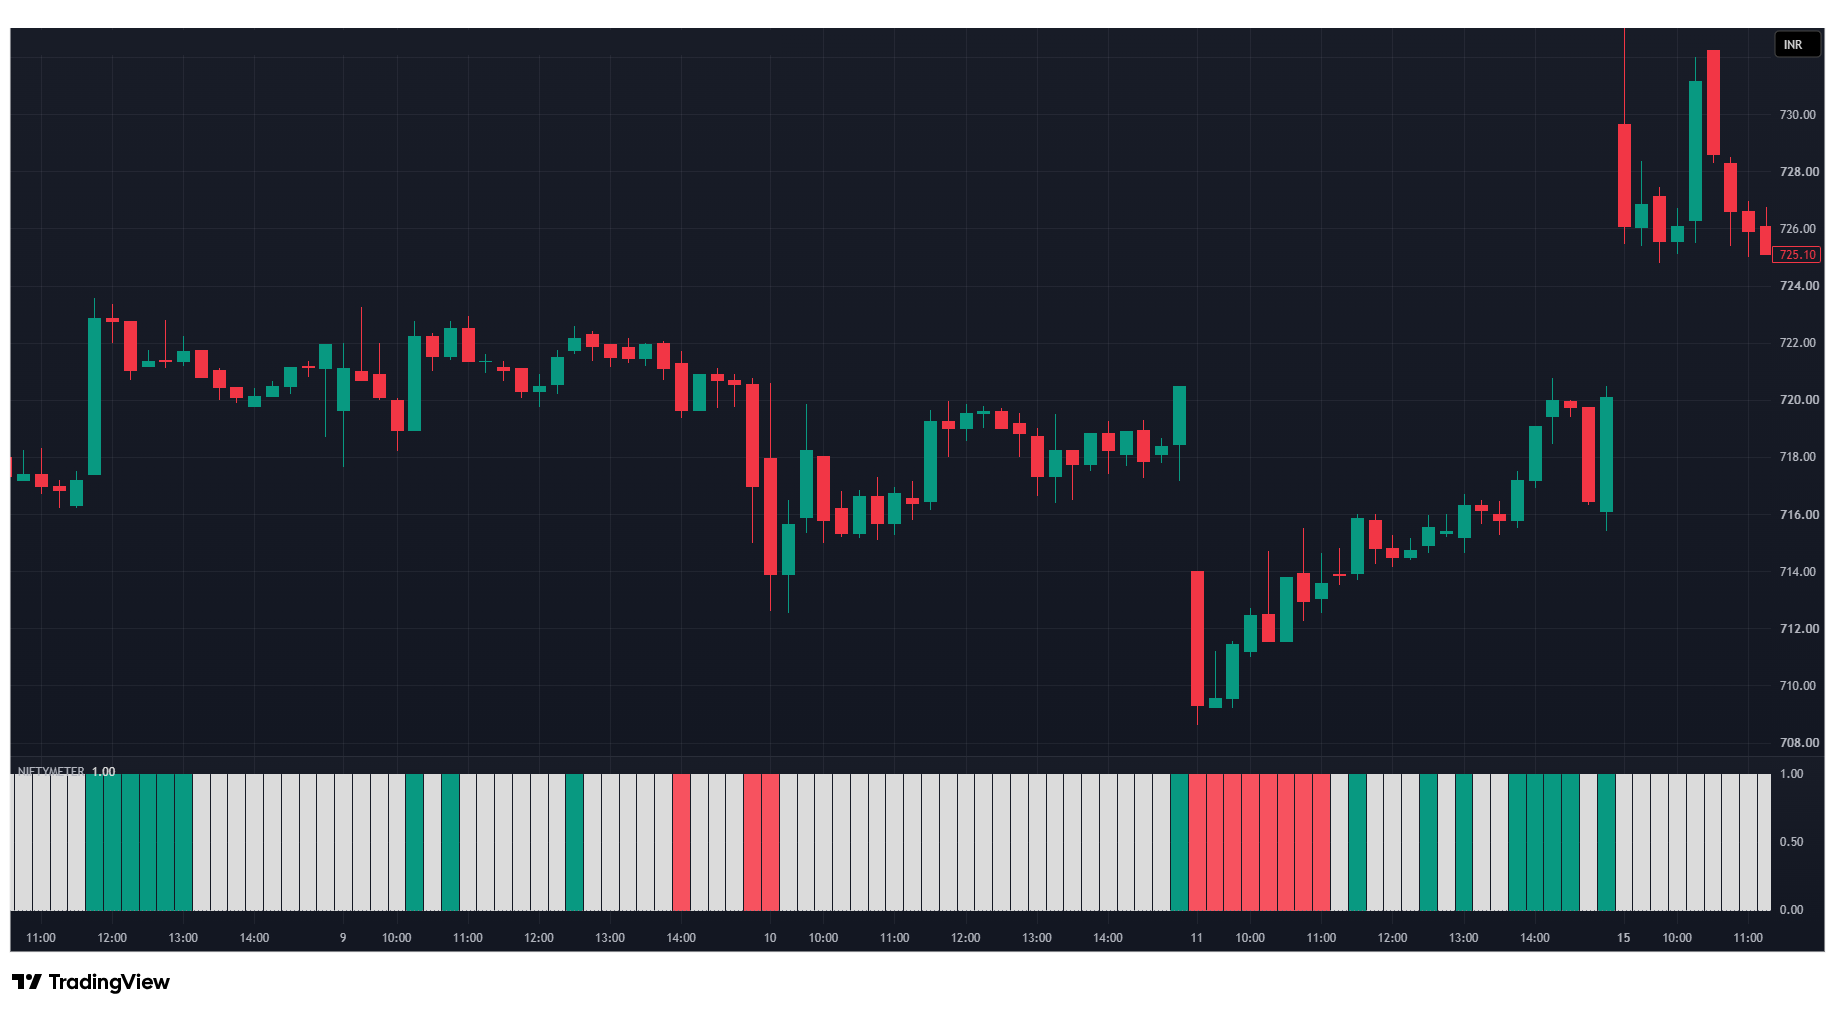
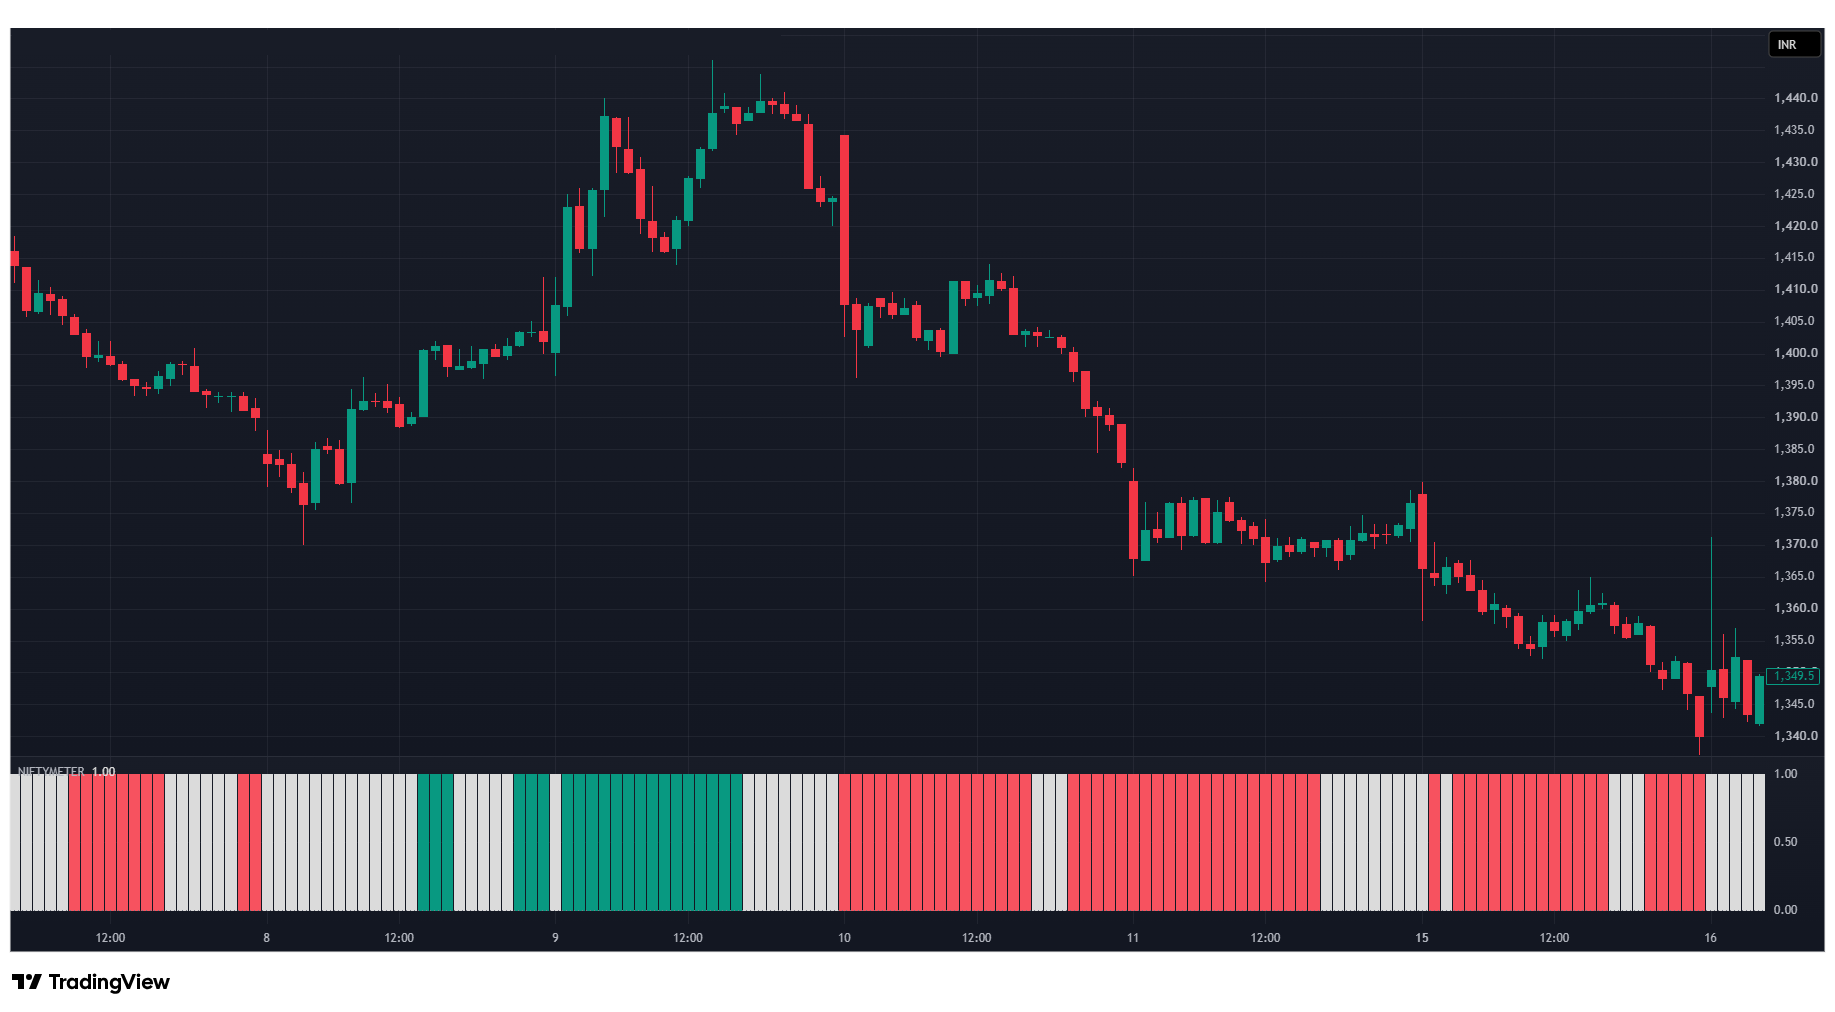
Real charts with NiftyMeter added. Watch the coloured band strip at the bottom: light colours mean the market is tradeable, dark colours and white mean wait. Tap each tab to see the three market moods: bullish, bearish and neutral.
BULLISH — Green bands
Price is climbing and the bands turn green. Light green is a tradeable zone — look for a buy entry above the previous candle's high, with a stop loss below the recent low.
Bullish ▲Tradeable ✓
Green — Bullish · Tradeable
Buyers are in control. Look for a buy entry when a candle closes above the previous high, with a stop loss below the recent low.
Red — Bearish · Tradeable
Sellers are in control. Avoid fresh buying and exit long trades when a candle closes below the previous low.
White — Neutral · No trade
No clear direction. Do nothing and wait for green or red to return — waiting is also a trade.
7-Day Free Trial

Start Learning Today.
No Payment, No Pressure.

Try everything for 7 days. Watch the videos at your own pace, practise on live charts, and ask questions in our WhatsApp group. Decide only after you feel comfortable.

  • 📊
    The NiftyMeter indicatorAdded to your free TradingView account. Works on any stock or index you open.
  • 🎬
    Learning videosStart from zero: what a candle is, how to read the colours, and how to plan your first trade.
  • 📋
    5 simple strategiesEach one tells you exactly when to enter, where to put your stop loss and when to take profit.
  • 💬
    WhatsApp support groupStuck? Ask in the group. No question is too basic.
FREE
7 days full access · No card required
  • ✦ NiftyMeter indicator on TradingView
  • ✦ 5 clear band colours: trade or wait
  • ✦ Beginner learning videos
  • ✦ 5 step-by-step strategies
  • ✦ WhatsApp help group
  • ✦ Works on Indian & US markets
Start My Free Trial →

🔒 100% free · No payment details · Stop anytime

Works Everywhere

Learn Once, Use It On Any Chart

The colours mean the same thing on every market, so you learn one simple method and use it everywhere.

📈
Stocks
NSE & BSE shares
📊
Index
Nifty, Bank Nifty & more
🇺🇸
US Stocks
Popular US shares
🥇
Gold
MCX Gold, XAUUSD
💱
Forex
USDINR & major pairs
₿
Crypto
BTC, ETH & more
Supported Timeframes
1 Min3 Min5 Min15 Min30 Min1 Hour4 HourDaily ★Weekly ★Monthly

Works on every intraday and positional timeframe. ★ Beginners: start with Daily or Weekly — fewer signals, less stress.

The NiftyMeter Method

3 Simple Steps. Real Charts.
Let the Cursor Show You.

Watch the cursor move across real charts and explain each step. Switch between the Bullish and Bearish examples — the same 3 steps work for both.

NiftyMeter · BULLISH EXAMPLE · 15M
Step 1 of 3
15-minute chart with NiftyMeter — bullish example HIGHER HIGHS ↗ GREEN = BULLISH · TRADEABLE WHITE → GREEN: TRADE ZONE STARTS WHITE = WAIT PREVIOUS HIGH ENTRY — CLOSE ABOVE HIGH ▶ STOP LOSS — below breakout candle Move stop loss to entry once in profit 💰 TARGET BOOK PROFIT LOWER HIGHS ↘ RED = BEARISH · TRADEABLE RED AGAIN = TRADE WHITE = WAIT PREVIOUS LOW ◀ EXIT / SHORT — CLOSE BELOW LOW STOP LOSS — above last swing high Move stop loss to entry once in profit 💰 TARGET BOOK PROFIT
Level
Value—
Signal—

Step 1 — Read the Trend: Is Price Making Higher Highs?

Before anything else, look at the candles. In a bullish chart each rise goes a little higher than the last one, and each dip stops above the previous dip. That pattern — higher highs and higher lows — tells you buyers are in control.

✅ Look at the last 20–30 candles and ask: are the tops getting higher?
✅ Pick stocks you understand or that have good news behind them.
❌ Do not buy just because one big green candle appeared — check the overall direction first.
📋 The Whole Method in 3 Lines
1
Trend — Higher highs = up. Lower highs = down.
→
2
Bands — Light green / light red = tradeable. Dark green, dark red or white = wait.
→
3
Plan — Enter on a close beyond the previous high/low in a light zone. Stop loss first, then target.
Why Beginners Like It

Everything Explained in Simple Words

No complicated indicators, no jargon. Just clear colours, simple rules and help whenever you need it.

🚦
Simple colour signals

Light green or light red means the market is tradeable. Dark green, dark red or white means wait. Like a traffic light — you know what to do at a glance.

📏
Key levels drawn for you

NiftyMeter marks important support and resistance zones, so you know where price may stop or turn — without drawing lines yourself.

🎬
Learn with videos

Short learning videos take you from "what is a candle?" to planning a complete trade. Watch them as many times as you like.

🛡️
Risk comes first

Every strategy starts with where to put your stop loss. You learn to protect your money before you try to grow it.

🧘
Fewer, calmer decisions

Dark and white bands tell you to wait. Most beginner losses come from over-trading — NiftyMeter helps you sit out the confusing days.

💬
Help when you are stuck

Ask doubts in the WhatsApp group and learn alongside other traders who started just like you.

Getting Started

Start in 4 Easy Steps — No Experience Needed

01
Send an enquiry

Fill the short enquiry form and choose “Free trial”. Add the email you use for TradingView. It takes less than a minute.

02
Get access in 24 hours

We add NiftyMeter to your TradingView account and send you the learning videos. A free TradingView account is enough.

03
Watch & practise

Start with the first learning video. Open a few charts and watch the bands move between light, dark and white — no money needed for this step.

04
Plan your first trade

Use one strategy, decide your stop loss first, and start small. Learn from every trade.

500+
Learners
24×7
AI Chat Help
5
Simple Strategies
5
Band Colours
Indian & US
Markets
What Members Say

Real Traders, Real Results

★★★★★

The signals are incredibly accurate. Everything was so easy to understand — I was profitable within my first week of the free trial.

RK
Rahul K.
Index Trader · Mumbai
★★★★★

I was a complete beginner. The 5 strategies gave me a proper plan to follow. I stopped guessing and started trading with logic. The Trend + Price panel is the first thing I check every morning.

PM
Priya M.
Swing Trader · Bengaluru
★★★★★

Invite-only is what sold me. The signals are never crowded. Levels have been spot on for 3 months. The WhatsApp group is also super active and helpful.

AS
Arjun S.
Intraday Trader · Delhi
Get in Touch

Have a Question? Send an Enquiry

Free trial, lifetime access, broker account or a doubt about the strategy — tell us what you need and our team will reply on WhatsApp or email within 24 hours.

📩 Send an Enquiry

We usually reply within a few hours on working days

🔒 Your details stay private and are never shared. We only use them to reply to your enquiry.

🎉

Thank you! Enquiry received

Our team will get back to you at or on WhatsApp within 24 hours. If you asked for a free trial, keep a free TradingView account ready.

Talk soon! 🚀

Beginner Questions

Questions New Traders Ask

Yes — it is built for complete beginners. The learning videos start from zero: what a chart is, what a candle means, and how to read the 5 band colours. You can learn and practise by just watching charts before you put in any money.
Light green — bullish and tradeable: look for buy entries.
Dark green — bullish but not tradeable: hold, don't start new trades.
Light red — bearish and tradeable: avoid buying, exit longs.
Dark red — bearish but not tradeable: stay out.
White — no trade zone: the market is undecided, so wait.
All of them — intraday (1, 3, 5, 15 and 30 minutes, 1 hour, 4 hours) as well as daily, weekly and monthly charts. Beginners should start with daily or weekly charts: signals are slower and calmer, which makes learning easier.
TradingView is a popular charting website and app. A free TradingView account is enough to use NiftyMeter — you only need to share the email you sign up with, so we can give you access.
Not for learning. You can watch the videos and practise reading charts without one. When you are ready to place real trades, you will need a demat and trading account with any SEBI-registered broker.
There is no minimum to learn. When you start trading, begin with a small amount you can afford to lose, and always use a stop loss. Increase your size only after you are consistent.
No tool can guarantee profits — anyone who promises that is not being honest. NiftyMeter helps you see the trend clearly and follow simple rules, including where to cut a loss. Results depend on your discipline and risk management.
Yes. They are: (1) Trend Confirmation Entry, (2) Breakout Play, (3) Breakdown Play, (4) Opening Range / Morning Gap, and (5) Pullback Entry. Each one explains the entry, the stop loss and the target in plain language, with chart examples.
If you find it useful, you can continue with NiftyMeter (see the Pricing section for the current offer). If not, your access simply stops — no charges, no hassle. We will remind you before the trial ends.

Still have a question? Ask NiftyMeter AI or send us an enquiry.

NM
Recent
started learning with NiftyMeter 🚀